
By Amyn Hassanally, Global Head of Private Equity Secondaries | Download this article (PDF)
The momentum for private equity secondaries is growing, with both secular trends and an underlying market shift driving a step-up in the opportunities available. Looking ahead, we identify the market dynamics that may indicate more growth is to come.
The private equity secondaries market is entering a new phase of maturity. After seeing record-breaking volumes in 2024, the first half of 2025 reached unprecedented levels of activity, registering over $100 billion in deal volumes.¹
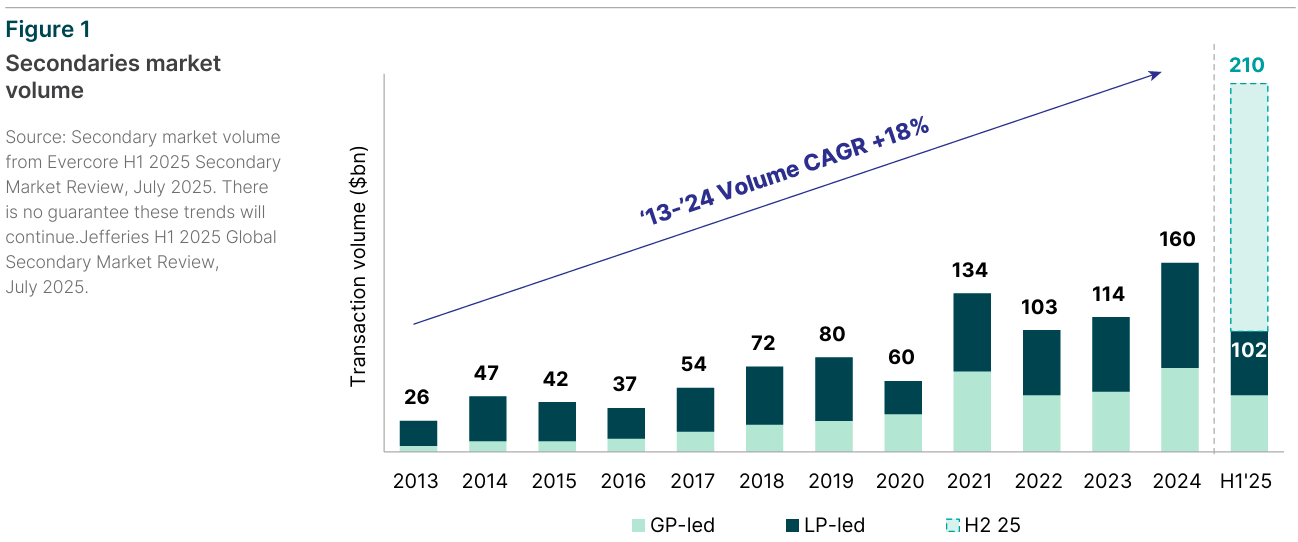
Investment banks operating in the market and other intermediaries estimate that full year deal volumes for 2025 will exceed the $200 billion threshold – a remarkable milestone for the secondaries industry.²
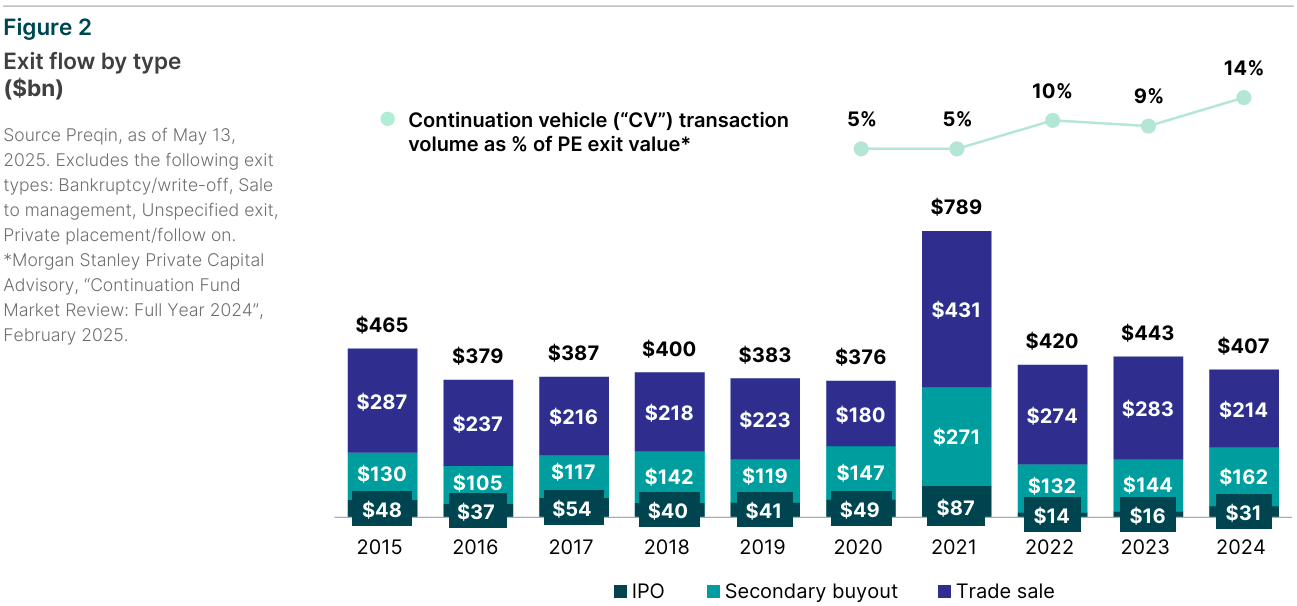
Central to this story is the pace of private equity exits, with the secondaries market filling the liquidity gap as exits remain muted for the fifth straight year.
With fewer exits, liquidity constraints in the primary markets have accelerated reliance on continuation vehicles and secondary sales as the primary liquidity channel for LPs and GPs alike. The proportion (by value) of private equity sponsors exiting positions via continuation vehicles continues to increase, and in 2024 these accounted for 14% of all total private equity sponsor exits.³ This is the highest proportion on record, and a remarkable uptick from just five years ago, when continuation vehicles accounted for only 5% of private equity sponsor exits by value.⁴
But the muted exit environment doesn’t tell the whole story, and we see several other drivers of secondary market growth that we anticipate will play out for years to come.
The secular themes that are likely to bring more supply to this market include:
- The increased use of secondaries as a portfolio management tool. In 2024, some 51% of LP sales were driven by portfolio management considerations, up from 38% the year before.⁵ Institutional sellers are now routinely looking to the secondaries market to rebalance or trim their portfolios – not at any price – but typically with a reserve price in mind and a minimum amount of NAV they are looking to realize.
- Growing transaction sizes across both LP- and GP-led markets. The average size of GP-led deals in 2024 jumped 16% year on year to $870 million on average.⁶ There have also been a number of multi-billion dollar LP portfolio trades taking place, with eight continuation vehicles topping $2 billion in the first half of 2025.⁷
- Broader adoption across asset classes and industries. The supply of LP portfolios has expanded to include private credit, infrastructure, real estate, and venture capital interests, all trading on secondary markets in increased volumes. Intermediaries expect record volumes in infrastructure and credit this year, with more purpose-built vehicles being launched.⁸
- More programmatic selling from traditional LPs. The seller base in the private credit secondary market is becoming more diversified, with sovereign wealth funds and endowments increasing their share of LP sales to 12% and 15% respectively in the first half of 2025.⁹ Programmatic sellers, such as funds of funds and traditional LPs, are developing programs to sell older portfolios, creating additional supply. Secondaries activity is no longer opportunistic.
- The fourth consecutive year of muted distributions. Selling has ticked up as distributions to LPs have largely trailed capital calls over the past three years.¹⁰
The private equity secondary market is not only benefitting from a growing volume of supply, but more capital is being raised by a variety of players to absorb the tremendous opportunity set we’re seeing. The structural drivers for this growing demand include:
- An influx of retail capital via evergreen vehicles. Evergreens, and semi liquid vehicles, have long been active in the secondaries market, but their exposure to private equity recently accelerated. Some 45% of the evergreen vehicles launched in the last three years had private equity exposure.¹¹ Many of these funds are deploying aggressively into secondaries opportunities as they ramp up, looking to benefit from the J-curve mitigation and diversification offered by the market. GPs managing 40’Act and other evergreen funds now account for more than $80 billion in net asset value (NAV), a 100% increase from late 2023.¹²
- New sponsor entrants to secondaries. We continue to see a steady stream of new entrants to the market, with direct sponsors entering the GP-led market, which remains probably the most undercapitalized part of the market today, and asset managers launching dedicated secondaries vehicles across asset classes.
- Continued secondaries fundraising growth. Fundraising among incumbent secondary players remains robust, with managers raising increasingly larger funds to address the opportunity on offer. Around $81 billion was raised in final closings in the first half of 2025 alone, a record in secondary fundraising, with intermediaries expecting another $150-200 billion to be raised in the next 12 months¹³ with mega funds surpassing buyout funds in size.¹⁴
- The emergence of specialized buyers focusing on particular asset classes or sectors. Specialized pools of capital are emerging to absorb secondaries across specific asset classes, with a record number of real assets and credit secondaries funds now out in the market.¹⁵ Secondaries sponsors are venturing into these new asset classes to see alpha,¹⁶ and we expect this trend to continue.
Where next for private equity secondaries?
This backdrop of growth is remarkable, and we see no signs that the market’s development is slowing. The amount of unrealized NAV in private equity buyout funds alone has been steadily accumulating, reaching around $3.6 trillion, from some 29,000 companies. More than 50% of this NAV (around $1.8 trillion) has been held for at least four years.
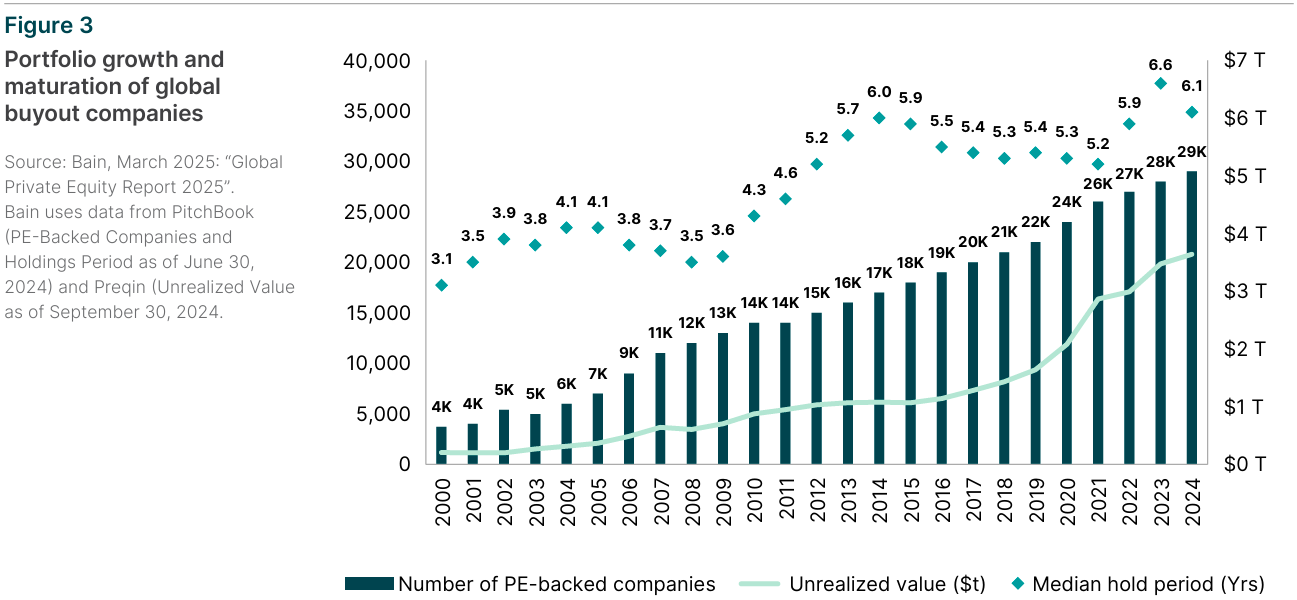
This is a deep and maturing opportunity set, and as GPs and LPs alike look to actively manage their portfolios we anticipate this will lead to more robust activity in the continuation vehicle market and for LP portfolios. It will take time for these assets to work their way through the system, even given the record amount of dry powder available. Today, there is thought to be around $219 billion of near-term secondaries capital available, with this number rising to $302 billion when you include leverage, co-investor capital, and near-term fundraising.¹⁷
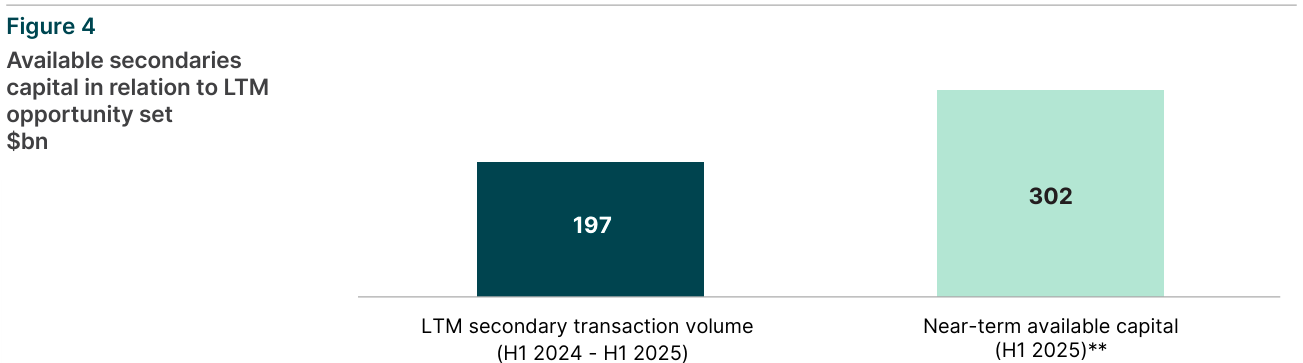
Notably, this is less than two years’ worth of near-term capital relative to the transaction volumes of the last 12 months, as secondary buyers are taking advantage of the attractive market dynamics to deploy their dry powder almost as quickly as they are raising capital. This has meant that dry powder has not accumulated meaningfully over time, maintaining the supply-demand imbalance in the market that we believe will continue to favor secondary buyers for years to come.
We also regard the outlook for buyout fund pricing as strong, with terms currently at the most attractive levels seen in the last decade. While spreads have tightened from where they were in 2023,¹⁸ discounts remain driven by fund maturity, asset quality, secure exposures, and competitive dynamics, with good dispersion between LP- and GP-led processes.

To sharpen their returns, we have seen secondary buyers continue to utilize structural solutions like deferrals and leverage, and we anticipate that this is a trend that will continue to grow.
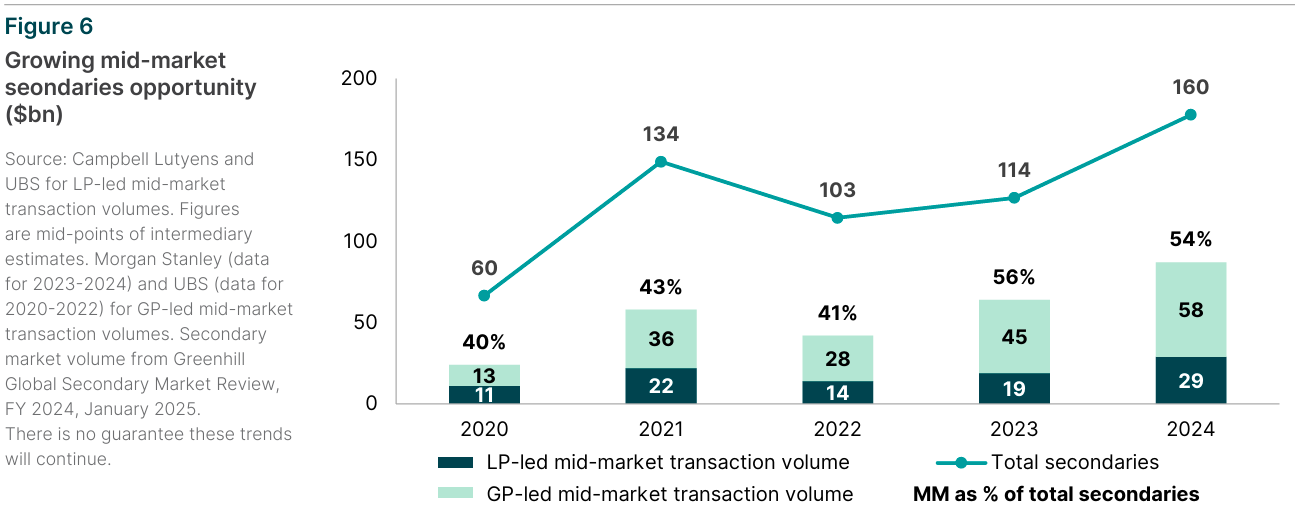
The final market dynamic that we expect will continue to dominate is the increasing importance of the mid-market to the secondary market. Over 2023 and 2024, mid-market deals represented more than 50% of all secondary market deals, with GP- and LP-led deal flow from this segment increasing.
On the GP-led side of the market, some 82% of single-asset continuation vehicles were in companies with EBITDA below $250 million.
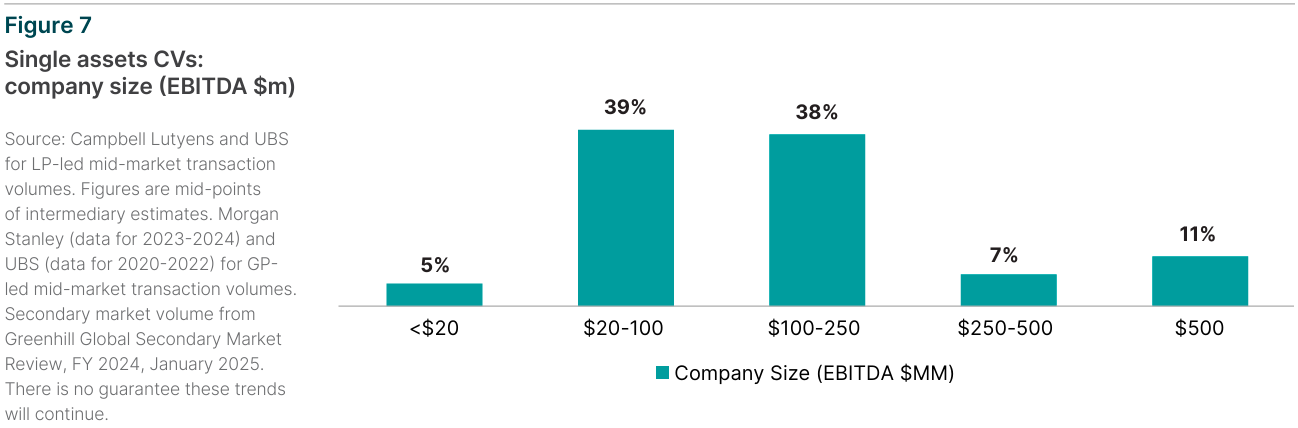
The concentration of single-asset CVs around smaller companies creates a distinct opportunity set versus large-cap continuation funds, with the number of GPs enforcing transfer restrictions when LP interests are being transferred is materially more prevalent in the mid-market.
Watch: How the private equity secondary market is developing