
insights

State of the market: what’s next for private equity secondaries

by Amyn Hassanally, Global Head of Private Equity Secondaries | Download this article (PDF)

After a record-breaking year for secondaries volumes in 2025, with deals crossing the $200 billion threshold for the first time to reach $226 billion globally, the structural imbalance in today’s private equity market could promise something even more impressive to come.

The private equity secondaries market has a habit of turning necessity into infrastructure. What began as a way for investors to tidy up portfolios has, in the space of a few years, become an increasingly central route for liquidity, portfolio management, and dealmaking.

2025 marked a turning point for secondaries in the private markets. Transaction volumes reached $226bn, breaking through the $200bn threshold for the first time and eclipsing 2024’s previous record by more than 40%. Volumes in the first half of 2026 continued this upward trajectory, reaching a record $121bn, up from the $102bn seen in the same period in 2025.¹

That scale matters less for the bragging rights than for what it signals: secondaries are now large enough to be shaped by structural forces rather than cyclical panic.
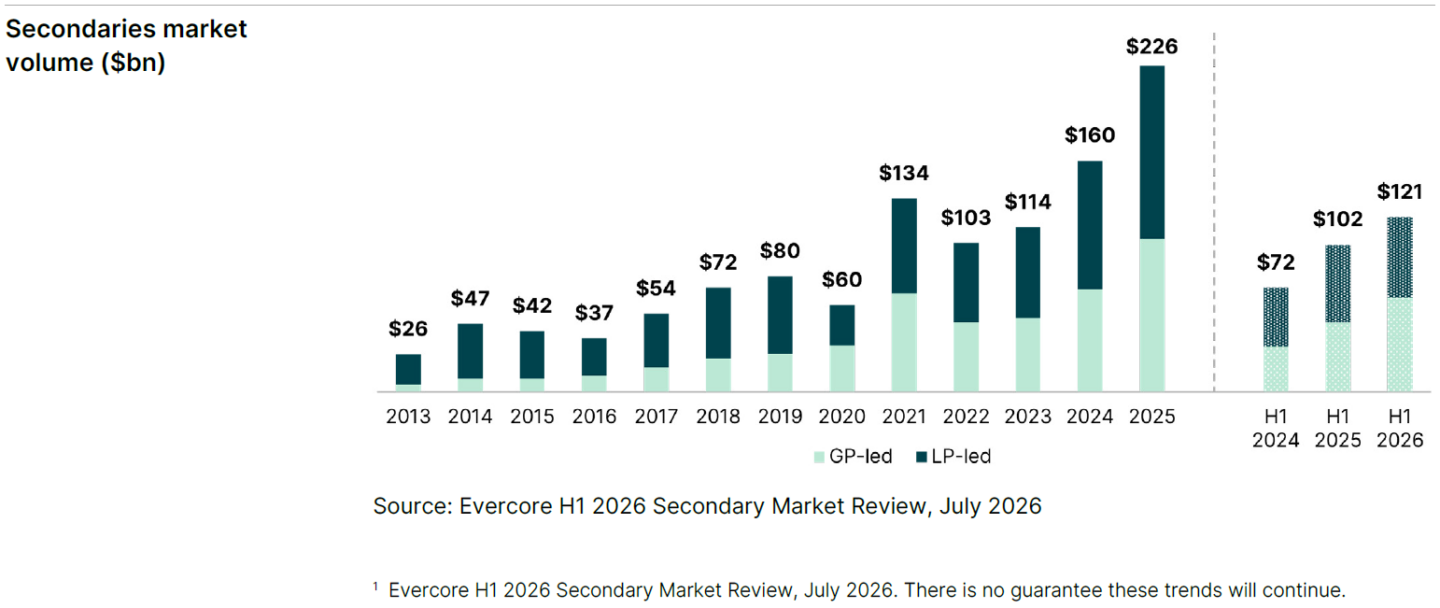
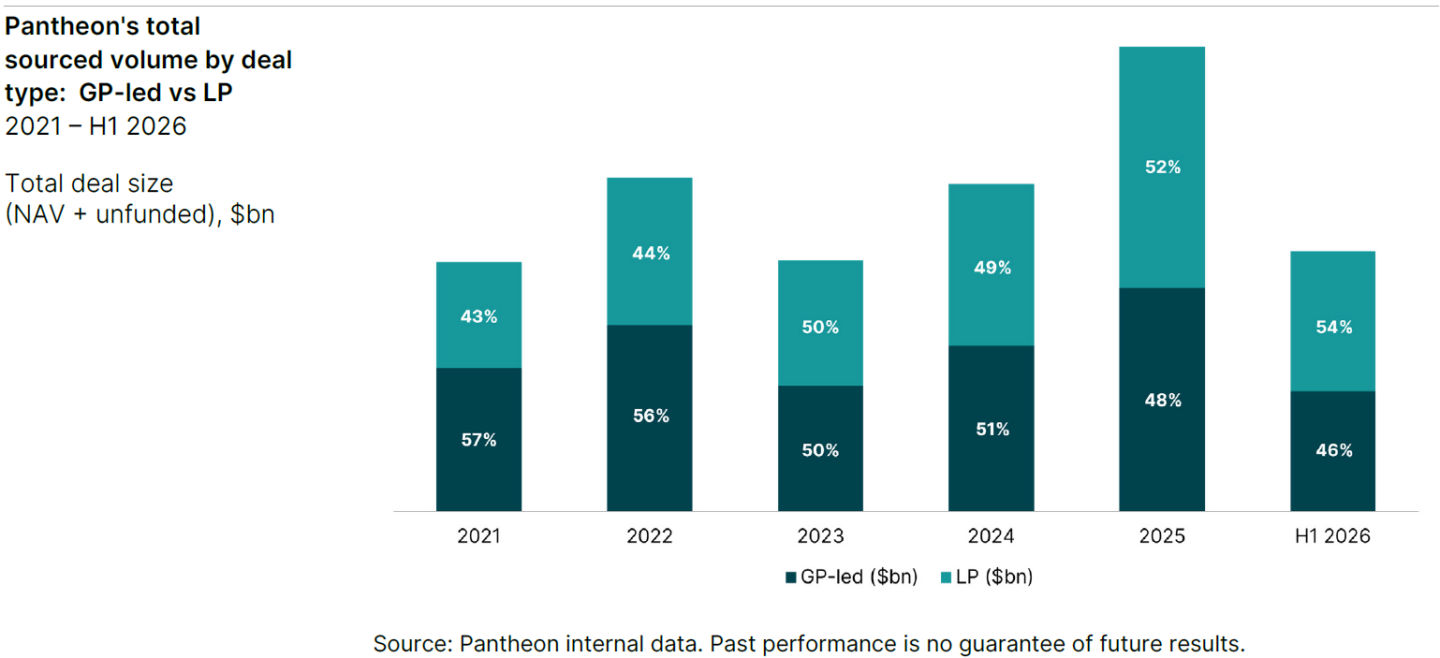
Roughly 54% of activity in the first half of 2026 was GP-led, with the remaining 46% driven by LP-led transactions.² This near-even split between GP- and LP-led deals emphasizes just how broadly secondaries have become embedded across private markets portfolios. And with the majority of recent secondaries sellers being first-time sellers, the market looks set to continue to grow.³

The private equity market backdrop

While the private equity market has faced challenging headwinds in the last few years, some confidence has returned to the wider asset class in recent months. There has been a gradual recovery in dealmaking, company growth rates have stabilized,⁴ and there are early signs this may be having a normalizing effect on deals and exits. Although the macro environment remains volatile, there has been a growing acceptance of that market backdrop and an understanding that delaying deals in the hope that circumstances will improve carries little advantage.⁵

Overall, private equity volume was up 26% last year, with large transactions a significant driver of that volume. Volumes remained high through H1 2026, which kept pace with H1 2025.⁶
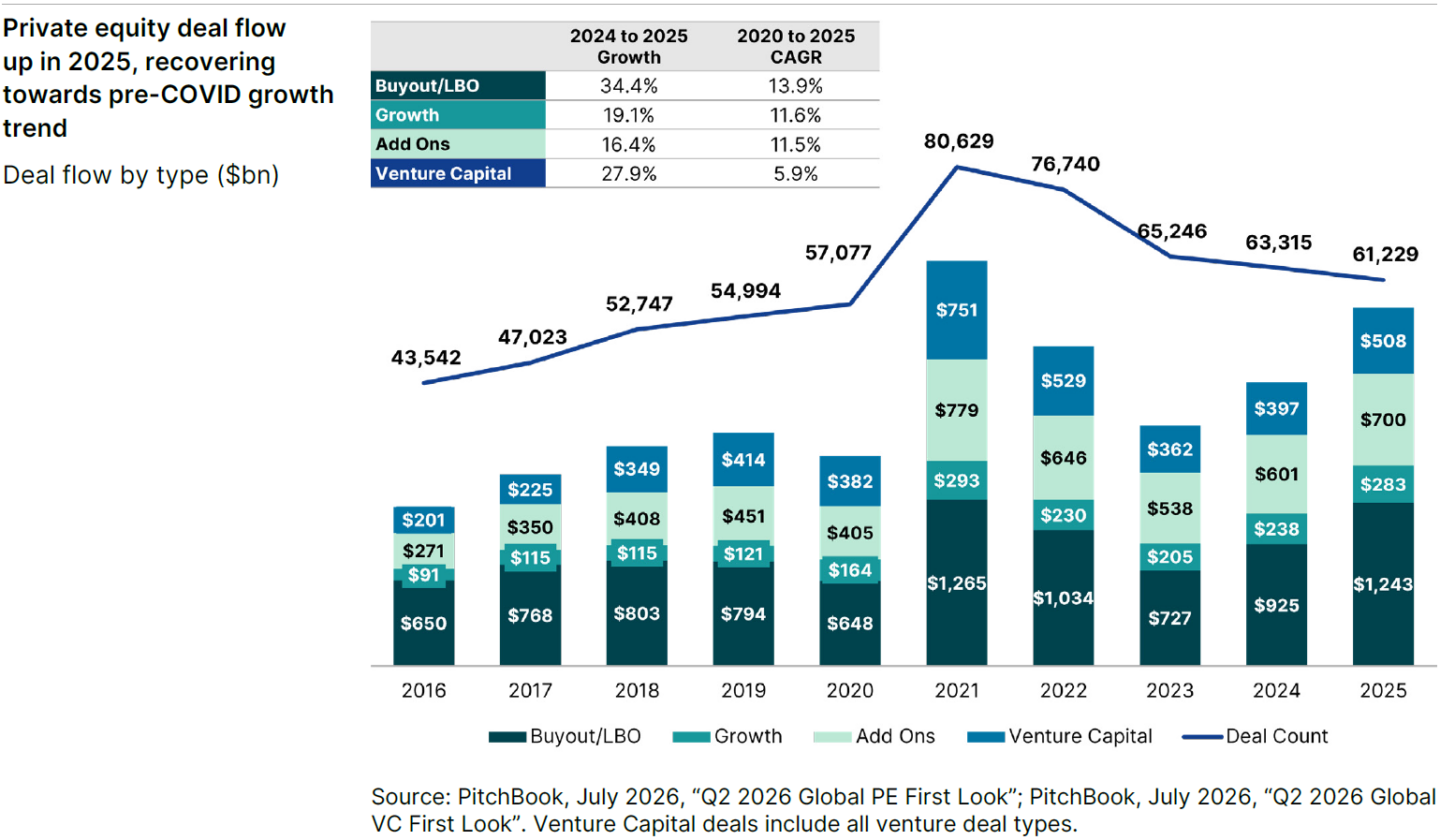
Overall, the market saw around $275 billion of activity last year.⁷ Thirteen deals with enterprise values of over $10 billion were completed in 2025, including the $57 billion Electronic Arts deal, $28 billion for Air Lease Corp, and $24 billion for Walgreens Boots Alliance.

Meanwhile, exits were up about 60%, making 2025 the strongest year recorded since 2021. H1 2026 saw continued recovery, with 25% growth year over year.⁸
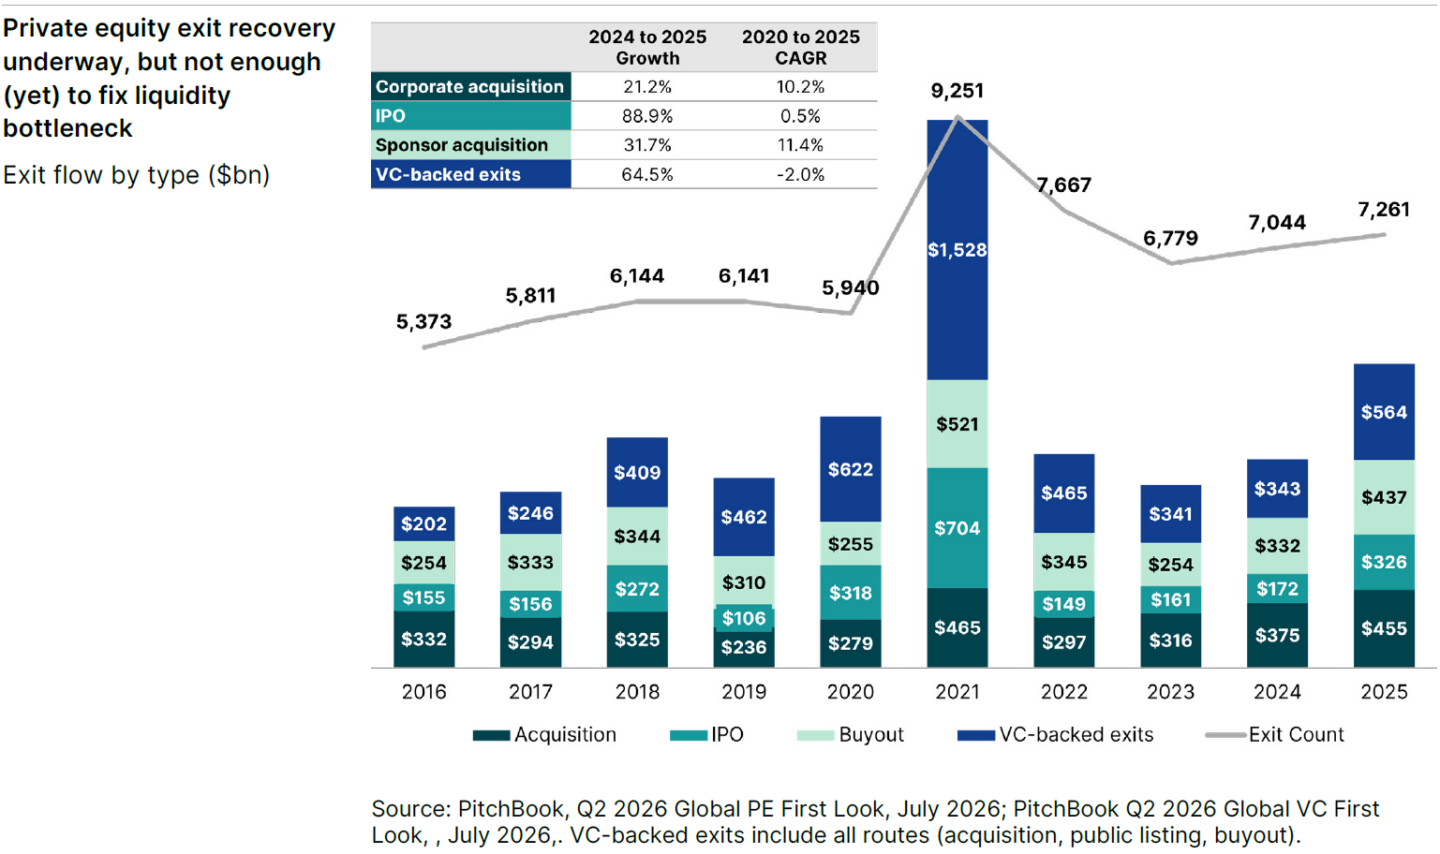
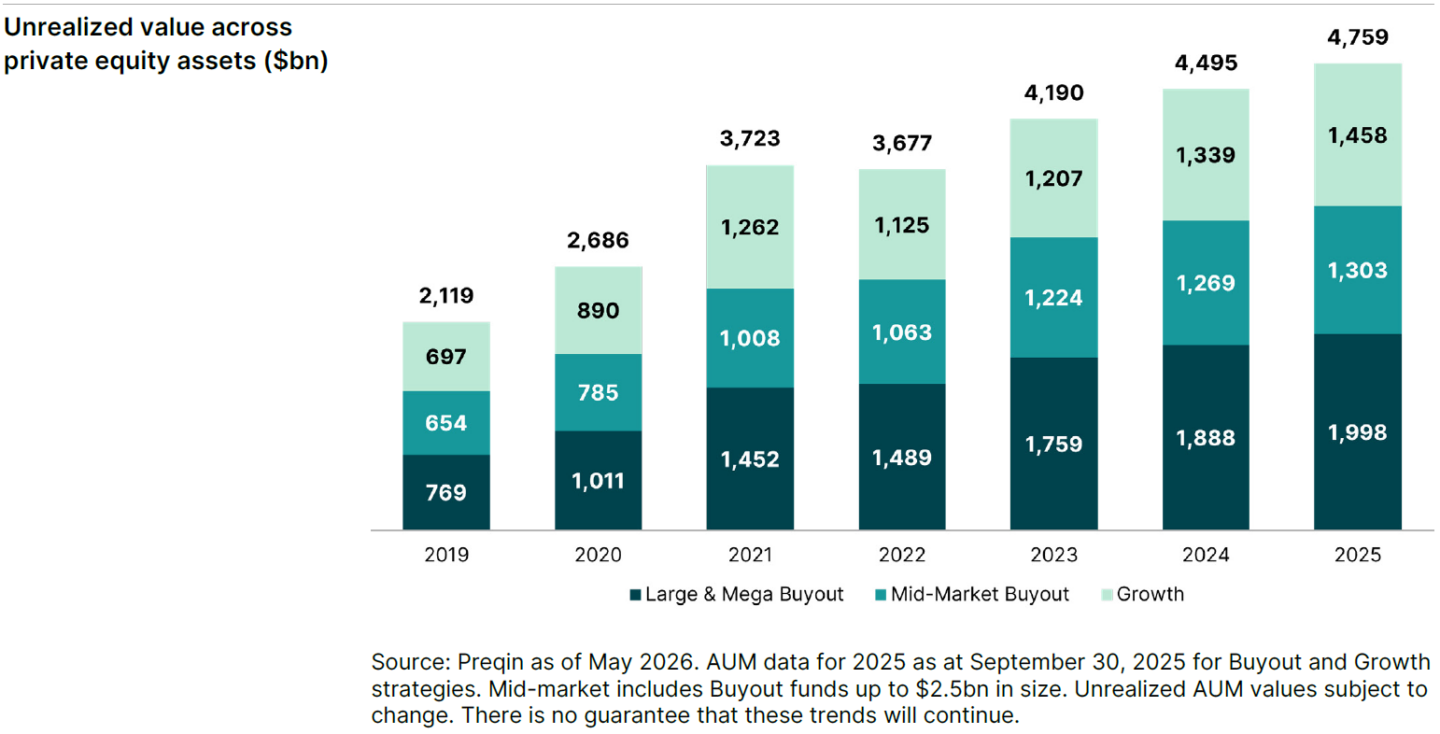
But even though these numbers are large in absolute terms, the net asset value (NAV) base has also grown substantially and as of 2025 has nearly doubled from what it was in 2020.⁹ Therefore, distribution rates were only around 14% of NAV last year, the fourth straight year when this figure fell under 15%, while the previous decade’s average (2012-2021) was 18%.¹⁰ Average holding periods for buyout assets have lengthened, from 6.1 to 6.6 years,¹¹ notwithstanding the market’s positive signs, and there are thought to be around 32,000 unsold companies sitting in private equity portfolios.¹²

That equates to roughly $4.8 trillion of unrealized NAV sitting in private equity funds today, nearly double what it was in 2020.¹³ Of that, about 80% sits in funds that are four years old or older,¹⁴ past the point where LPs would normally expect some liquidity.

Even in the healthiest exit environment, this stock of mature NAV cannot be liquidated in the near term. There are only so many companies that can list or be sold in a year. This backlog accumulates, creating a durable and fairly visible pipeline for secondary transactions in the coming years.
From liquidity tap to portfolio tool

On the LP side of the secondaries market, sales are increasingly driven by active management rather than distress. Institutions are using the market to rebalance concentrated exposures, respond to leadership changes, manage denominator effects during downturns, and generate liquidity for redeployment. A growing number of pensions, endowments, fund of funds, and sovereign wealth funds now run portfolio sales on a recurring basis.

Despite record volumes, turnover remains modest relative to the size of private equity overall. Historical calculations based on secondary volumes and total NAV suggest roughly 2-3% of private equity assets trade annually in the LP market.¹⁵ Private markets remain structurally illiquid; secondaries have become the mechanism through which that illiquidity is managed.

At the same time, deal sizes have grown in tandem with institutionalization and increasing capital formation. The rise of “mega” secondary funds has created the capacity to absorb ever-larger portfolios, intensifying competition at the top end of the market. This concentration of capital has sharpened the competitive dynamics in large-cap trades, prompting some managers to focus on less penetrated segments of the market, particularly the mid-market where relationships, data scarcity, and underwriting selectivity can offer an edge.

GP-leds move into the mainstream

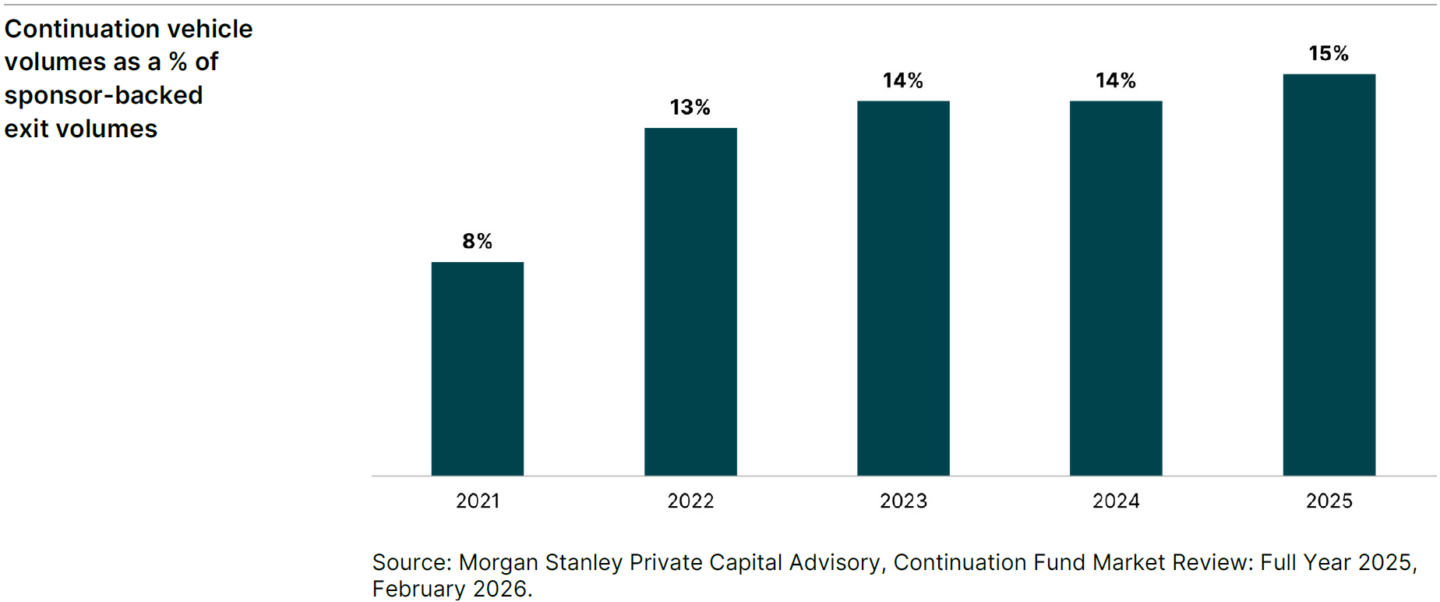
If LP-led secondaries reflect portfolio housekeeping, GP-led transactions speak to structural change in private equity exits. GP-leds now account for 15% of all private equity exits, up from just 8% in 2021,¹⁶ and GP-led transactions make up roughly half of the total secondaries market today (and over 50% of secondaries deal volumes in the first half of 2026).¹⁷

The GP-led market in its current form began to take shape around 2019, with 2021 delivering a surge fit for pandemic-led headlines when secondary volumes doubled compared with the year before.¹⁸ After relative stability in 2022 and 2023, growth accelerated again between 2023 and 2025. Over that period, GP-led volumes expanded at a compound annual growth rate (CAGR) of 49%, far outpacing M&A even as that market rebounded with 19% CAGR.¹⁹

The steady growth in continuation vehicle volume, even as the broader exit environment improved, also challenges the idea that continuation vehicle growth is simply a symptom of a weak exit market. Instead, it suggests that continuation vehicles are becoming a durable, structural part of how GPs manage their best assets, independent of where we are in the broader exit market cycle.²⁰
The opportunity in a nutshell

Based on these figures, the opportunity ahead for the private equity secondaries market is compelling. If the average hold period of buyout funds remains around 6.6 years, a $3.8 trillion backlog of aging NAV will need to find an exit over the next two to five years.²¹ And if GP-led transactions continue to account for around 15% of all sponsor exits by value over that period,²² we estimate that there will be around $570 billion of GP-led volumes over the next few years.²³ Should the proportion of GP-leds in the secondaries market remain around 50% (a share that has held fairly steady over the past 5 years based on our data),²⁴ then that could translate into a secondaries market for private equity assets alone of over $1 trillion cumulatively over the coming years.
Secondaries are no longer peripheral to private equity’s functioning. They have become integral to how capital is recycled, risk is managed, and ownership horizons are extended.

For investors, the market’s expansion presents both opportunity and new risks to managers. Scale has arrived. The task now is navigating it with discipline.

Why the mid-market opportunity stands out

In the last three years, the mid-market has grown to represent almost half of the overall secondaries market.25 Single-asset continuation vehicles are a significant part of that growth, and one that we believe still has considerable room to run.
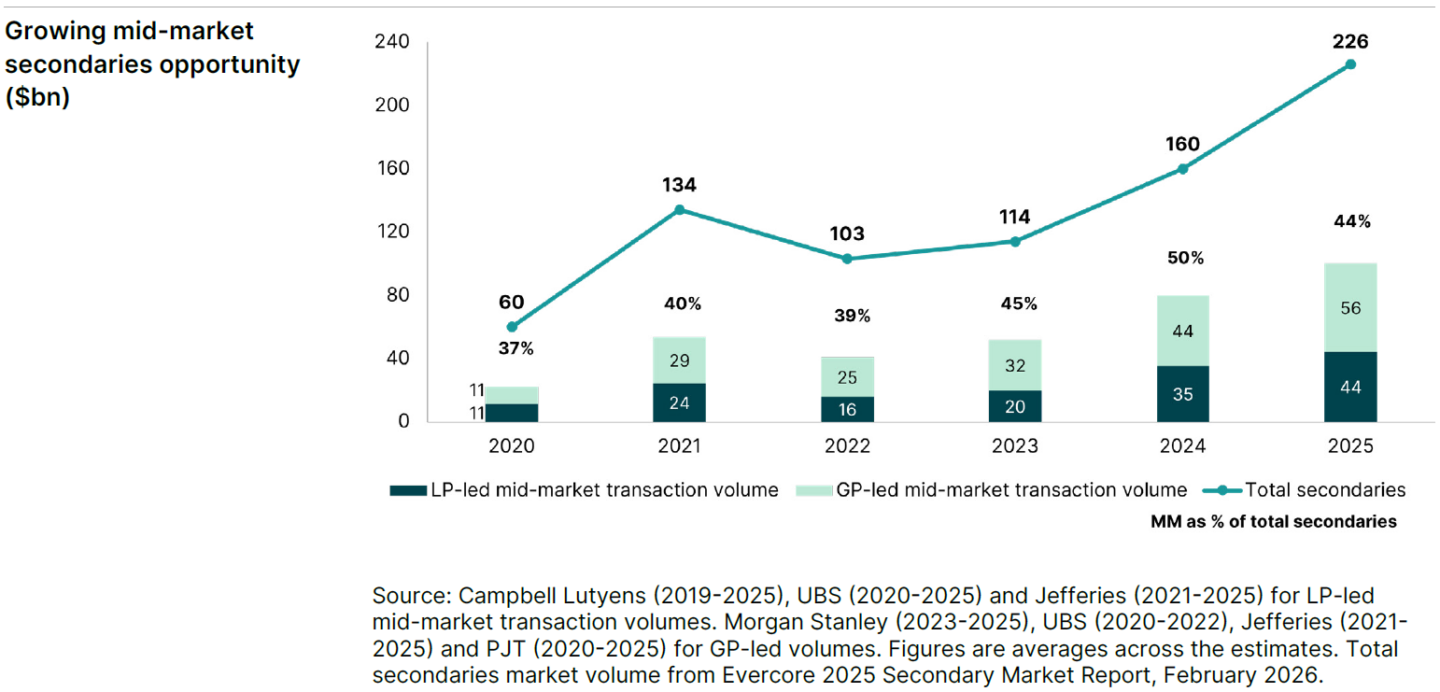
Part of the opportunity is structural: some 69% of private equity dry powder is concentrated in the top 20 secondaries managers,26 and secondaries “mega” funds don’t, for the most part, run dedicated mid-market strategies. That leaves the mid-market as a comparatively underserved hunting ground for secondary transactions.


Download this article (PDF)

This publication has been prepared solely for illustration, educational, and/or discussion purposes. It does not constitute independent research and under no circumstances should this publication or the information contained in it be used or considered as an offer, inducement, invitation, solicitation, or recommendation to buy or sell any security or financial instrument or service or to pursue any investment product or strategy or otherwise engage in any investment activity or as an expression of an opinion as to the present or future value or price of any security or financial instrument. Nothing contained in this publication is intended to constitute legal, tax, securities, or investment advice. This publication may include “forward-looking statements”. All projections, forecasts, or related statements or expressions of opinion are forward-looking statements. Although Pantheon believes that the expectations reflected in such forward-looking statements are reasonable, it can give no assurance that such expectations will prove to be correct, and such forward looking statements should not be regarded as a guarantee, prediction, or definitive statement of fact or probability. Pantheon has taken reasonable care to ensure that the information contained in this document is accurate at the date of publication. However, no warranty or guarantee (express or implied) is given by Pantheon as to the accuracy of the information in this document, and to the extent permitted by applicable law, Pantheon specifically disclaims any liability for errors, inaccuracies, or omissions in this document and for any loss or damage resulting from its use. Unless stated otherwise, any opinions expressed herein are current as of the date hereof and are subject to change at any time. Unless stated otherwise, all views expressed herein represent Pantheon’s opinion.

This document is distributed by Pantheon, which is comprised of operating entities principally based in San Francisco, New York, London, Dublin, Singapore, and Tokyo. Pantheon Ventures Inc., Pantheon Ventures (US) LP and Pantheon Infra Advisors LLC are registered as investment advisers with the U.S. Securities and Exchange Commission (“SEC”) and Pantheon Securities LLC, is registered as a limited purpose broker dealer with the SEC and is a member of the Financial Industry Regulatory Authority (“FINRA”) and the Securities Investor Protection Corporation (“SIPC”). Pantheon Ventures (UK) LLP is authorized and regulated by the Financial Conduct Authority (FCA) in the United Kingdom, as well as a registered investment adviser with the SEC. Pantheon Ventures (Ireland) DAC is regulated by the Central Bank of Ireland (“CBI”). Pantheon Ventures (Singapore) Pte. Ltd holds a capital markets service license from the Monetary Authority of Singapore (“MAS”) to conduct fund management with accredited and institutional investors. The registrations and memberships described above in no way imply that the SEC, FINRA, SIPC, FCA, CBI or MAS have endorsed any of the referenced entities, their products or services, or this material. All materials published herein are protected by copyright, and are owned or controlled by Pantheon as the provider of the materials. If you download any information or software from this Site, you agree that you will not copy it without the prior written consent of Pantheon or remove or obscure any copyright or other notices or legends contained in any such information.

This material may incorporate insights or content generated through the use of artificial intelligence (“AI”) tools, including generative AI. The use of AI can pose risks to Pantheon and its investors. Certain risks may be exacerbated by the use of AI, such as exposure of material non-public information and threats to cybersecurity. Pantheon maintains a comprehensive AI Acceptable Use Policy and related AI Enablement Framework that governs the responsible and compliant use of AI technologies in accordance with applicable regulatory frameworks across the jurisdictions in which the Pantheon Group operates. AI’s analysis is reliant on the input of data and it is unlikely that all relevant factors will be captured and considered, and consequently, it is likely that the AI output could be inaccurate or flawed. All work carried out and work product created by Pantheon and its affiliates are always subject to human review, oversight, and approval to ensure accuracy, appropriateness, and regulatory compliance. Pantheon does not use AI to make investment, allocation, or other portfolio-related decisions, which remain under the exclusive purview of experienced investment professionals applying established processes and discretion.

Copyright © Pantheon 2026. All rights reserved.

    1. Evercore H1 2026 Secondary Market Review, July 2026. There is no guarantee these trends will continue.
    2. Evercore H1 2026 Secondary Market Review, July 2026.
    3. Evercore 2025 Secondary Market Report, February 2026.
    4. Lincoln Private Market Index, Q2 2026, August 2026.
    5. Pantheon opinion. The relative advantages of executing transactions now versus at a later date cannot be predicted with certainty.
    6. PitchBook, Q2 2026 Global PE First Look, July 2026. Includes all private equity deal types and excludes venture capital.
    7. PitchBook, Q1 2026 Global PE First Look, April 2026.
    8. PitchBook, Q2 2026 Global PE First Look, July 2026; PitchBook, Q2 2026 Global VC First Look, July 2026. The growth figure excludes SpaceX’s record-breaking $1.8 trillion IPO in Q2.
    9. Preqin, as of May 2026. Based on AUM data for Buyout and Growth strategies as of September 30, 2025 which stood at $4,759bn, 1.77x what it was in 2020 ($2,686bn).
    10. Preqin, as of July 2026. Total private capital distributions as a % of unrealized value.
    11. McKinsey & Company Global Private Markets Report 2026. Historic average hold period based on 2011-2020 data compared to 2025.
    12. Bain & Company Global Private Equity Report 2026.
    13. Preqin as of May 2026. AUM data for 2025 as of September 30, 2025 for buyout and growth strategies. Mid-market includes buyout funds up to $2.5bn in size. Unrealized AUM values subject to change.
    14. Preqin as of May 2026. Based on funds with vintage older than 2021.
    15. Turnover rate calculated as ratio of secondaries market volume over private equity NAV for each year. Secondary volume from Evercore 2025 Secondary Market Highlights. Historic PE AUM for buyout and Growth from Preqin Pro as of February 2026.
    16. Based on Jefferies and Dealogic reporting on CV volume over sponsor-backed exit deal volume, including M&A and IPO proceeds.
    17. Evercore H1 2026 Secondary Market Report, July 2026. GP-leds made up 53.7% of total transacted volume in H1 2026.
    18. Source: Jefferies for GP-led deal volume, Dealogic estimates for sponsor-backed exit deal volume, including M&A and IPO proceeds. Percentage represents CV volume over sponsor-backed exit volume.
    19. Pantheon opinion. Source: Jefferies for GP-led deal volume, Dealogic estimates for sponsor-backed exit deal volume, including M&A and IPO proceeds. Percentage represents CV volume over sponsor-backed exit volume. M&A market volumes from PWC Global M&A Industry Trends.
    20. Pantheon opinion.
    21. Campbell Lutyens (2019-2025), UBS (2020-2025) and Jefferies (2021-2025) for LP-led mid-market transaction volumes. Morgan Stanley (2023-2025), UBS (2020-2022), Jefferies (2021-2025) and PJT (2020-2025) for GP-led volumes. Figures are averages across the estimates. Total secondaries market volume from Evercore 2025 Secondary Market Report, February 2026. There is no guarantee these trends will continue.
    22. Jefferies Global Secondary Market Review, January 2026 and H1 2026; Lazard Secondary Market Report 2025. Single-asset continuation vehicles represented approximately 53% of GP-led transaction volume in 2025-H1 2026. There is no guarantee these trends will continue.
    23. LTM Concentration of dry powder from Evercore 2025 Secondary Market Report.
    24. Jefferies Global Secondary Market Review, January 2026 and H1 2026; Lazard Secondary Market Report 2025. Single-asset continuation vehicles represented approximately 53% of GP-led transaction volume in 2025–H1 2026. There is no guarantee these trends will continue.
    25. Campbell Lutyens (2019-2025), UBS (2020-2025) and Jefferies (2021-2025) for LP-led mid-market transaction volumes. Morgan Stanley (2023-2025), UBS (2020-2022), Jefferies (2021-2025) and PJT (2020-2025) for GP-led volumes. Figures are averages across the estimates. Total secondaries market volume from Evercore 2025 Secondary Market Report, February 2026. There is no guarantee these trends will continue
    26. LTM Concentration of dry powder from Evercore 2025 Secondary Market Report.